UK-based
Grey Alien Games will publish the game on behalf of Suricate Software, a
European game developer behind numerous classic casual titles. This follows a
similar agreement to bring Suricate’s other Jewel Match Solitaire titles to
Steam.
The new
game features 400 levels and 10 beautiful underwater scenes to build, with 18
additional Solitaire variants such as Double Klondike and Freecell Kings.
Players will also be able to enjoy 100 bonus Mahjong levels.
Grey
Alien Games has several of its own titles on Steam, including Regency Solitaire
and solitaire-driven RPG, Shadowhand.
Jewel
Match Atlantis Solitaire – Collector’s Edition is due to launch on 7 November,
2019.
For more
details or to wishlist, please visit the Steam store page, here:
Posted in Grey Alien Games, Press release | Comments Off on Jewel Match Atlantis Solitaire – Collector’s Edition coming to Steam
Previously I’ve written about the importance of collecting Steam wishlists before launch and about how well those wishlists may translate into sales at launch, but in this post I wanted to share my data about wishlist conversion rates during discount sales AFTER launch.
Collecting Data
In early 2016 Steam started reporting how many wishlist emails were sent out when you run a discount (e.g. during a weeklong sale or a Steam sale) and how well those wishlists converted into sales.
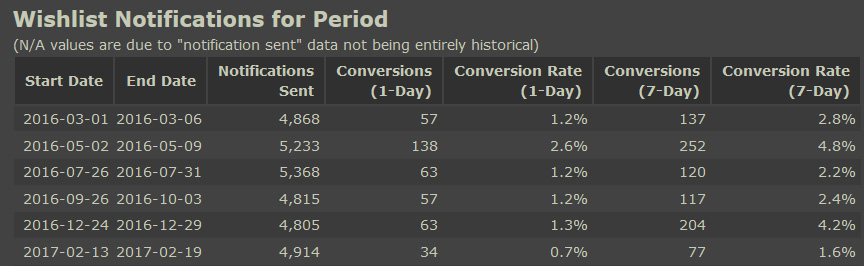
You can find the data for your game in the sales reporting system (not Steamworks). Click on your game and then click “view detailed wishlist breakdown”. Choose a date range of “all history” and then scroll to the bottom of the page and you should see a table like this:
I’ve used the 7-day conversion rate for the charts in this article. I also included the discounts I used on a couple of charts. You can find those in Steamworks by clicking your game and then clicking the well-hidden “add or edit discounts” button next to the pricing button.
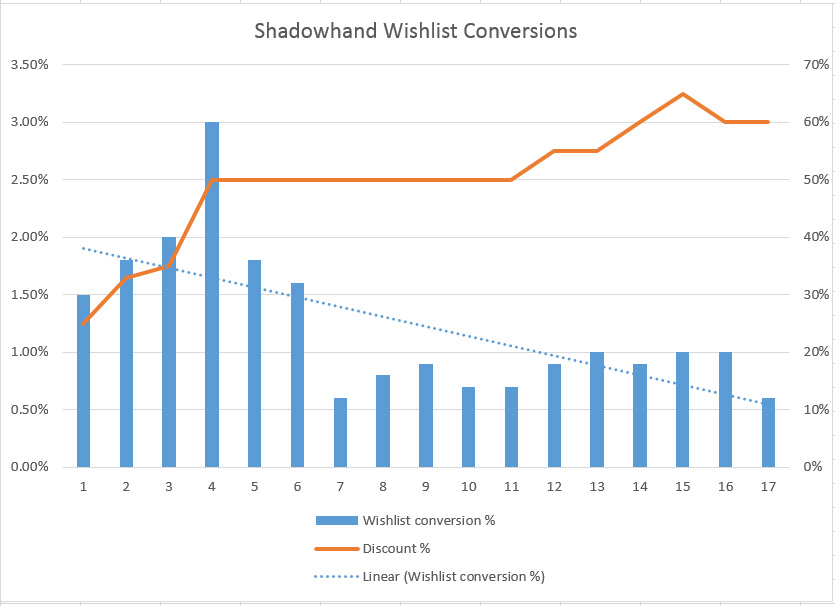
Shadowhand
Here’s the chart for Shadowhand. It launched with a 15% discount and then we stepped up the discount rate quite quickly to 50%.
Those early sales did pretty well but then the wishlist conversion rate dropped after the famous “October 2018 algorithm bug” (data point 7). I can’t say for certain it had an effect but it sure looks like something happened. Anyway, since then we’ve gradually pushed up the discount but have only managed to stabilise the wishlist conversion rate at about 0.9% rather than see any gains.
The overall conversion rate is 1.22%. So, for every 1000 wishlists the game has we make 12 sales, woo!
It should be noted that normally in a sale you also make “organic” sales that do not come from wishlists. Those can vary quite a lot (per game and per discount) but as a ballpark I find that wishlists account for about 50% of overall sales during a sale. Perhaps that’s a topic for a future article…
Pre-launch vs Post-launch wishlists
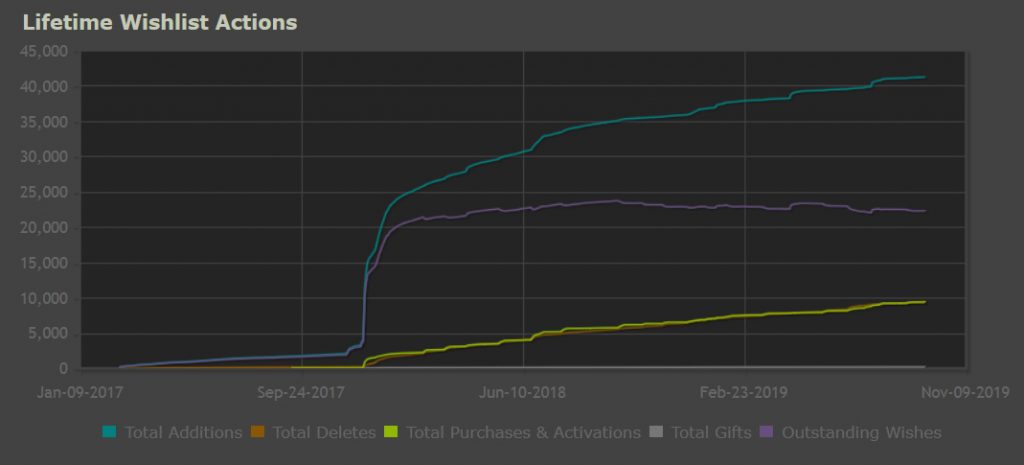
We had about 4000 wishlists before launch and they shot up to about 13,000 during launch week and then continued to climb rapidly through the Steam Winter 2017 sale to about 21,000. Most games exhibit similar behaviour on launch but at different scales.
In 2018 additions slowed down but were still climbing until the Oct algo bug when they began to decline slowly due to decreased visibility on the store (see the purple Outstanding Wishlists line below). We weren’t the only game to notice this.
Pre-launch wishlists can convert at about 10% on average, sometimes higher, sometimes lower. But after launch they won’t convert anywhere near as high as that; more like 1-2% on average. Post-launch wishlists can convert higher at around 3%-4% in your first few sales after launch, or with a steep discount later on, but those events are rare and the average is likely to be a lot lower. I say this having studied the data for 4 of my games over several years (more charts below).
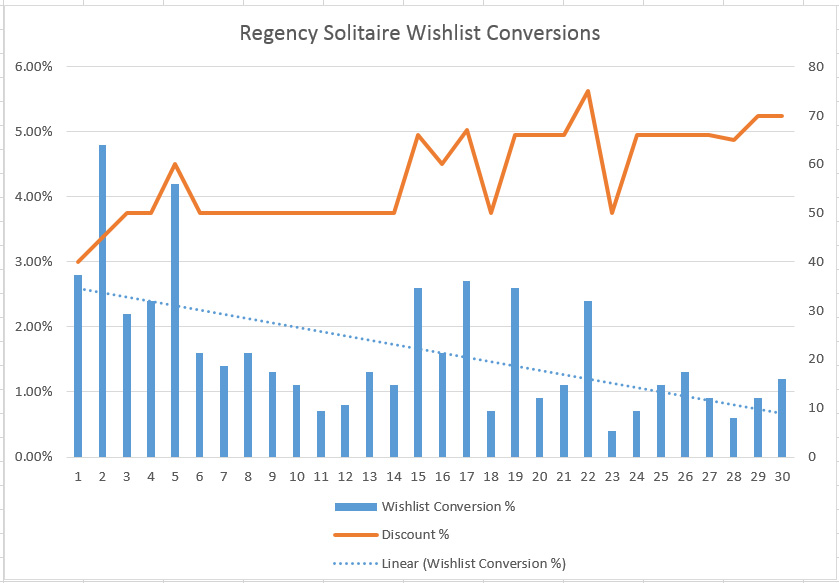
Regency Solitaire
Regency Solitaire launched on Steam in May 2015 which is before the wishlist conversion data was available, so this chart is missing the first 9 months of sales. The average on this chart is 1.63%.
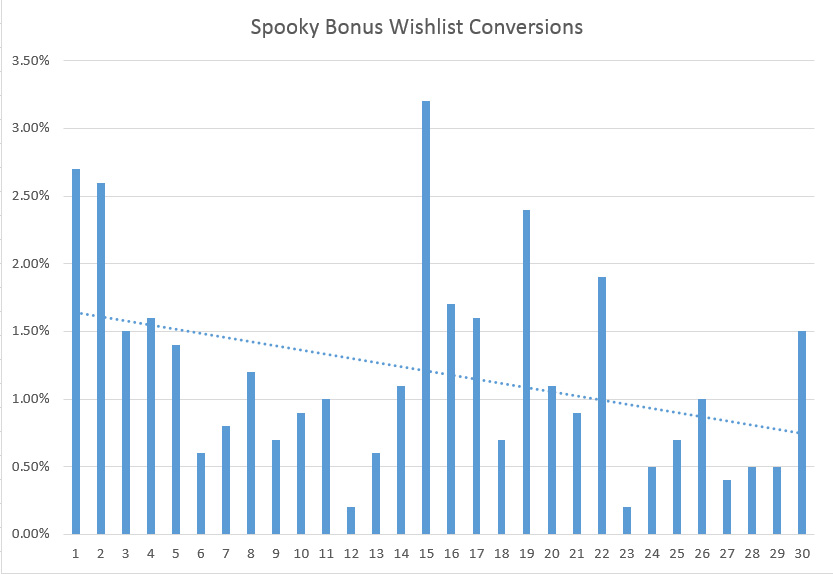
Spooky Bonus
This chart is also missing the first 4 months of data. I haven’t added in the discount percentages. The average is 1.19%
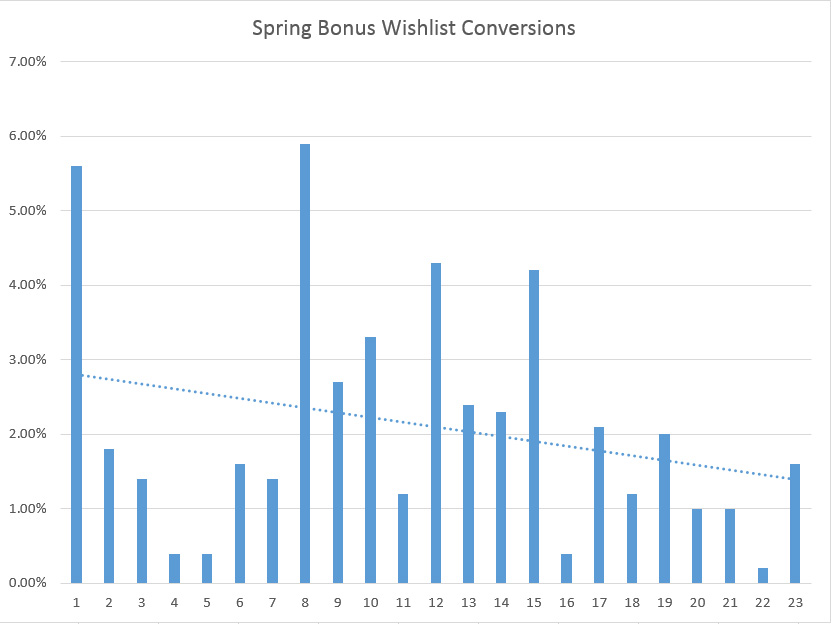
Spring Bonus
This data includes the first sale after launch which converted surprisingly well (5.6%) and during a later high discount but this game doesn’t have very many wishlists so the actual revenue was low. The average is 2.1%
Conclusion
For the four games above the average wishlist conversion rates range from 1.19% to 2.1% but it should be noted that they start higher than that and drop over time. The worst conversion rate I ever had in a sale is 0.2% and the best is 5.9%.
Don’t forget that just because you have a better conversion rate and in theory sell more units, if your discount was high, your revenue may not actually be any better than in previous lower discount sales.
Also, once you use a high discount you can’t really go much lower again (I confirmed this via experiments) otherwise your conversion rates will suffer. Furthermore, higher discounts lead to worse reviews on your store page because those customers are less invested in their purchase, so be careful.
Anyway, I hope you found this post interesting and can use the data to give you some idea about how your own games may perform. Also, if you have any of your own data to share, please do so in the comments.